
Key Points
- Conduct comprehensive research through fundamental and technical analysis, examining financial statements, analyzing industry dynamics and market trends and consider expert opinions.
- When researching stocks, it is important to consider a range of metrics and factors for valuable insights into a company's performance and potential.
- Our example of analyzing Apple (AAPL) stock showcases how to put the research techniques into practice.
- 5 stocks we like better than Alphabet
Stock research is critical to making informed investment decisions in today's dynamic financial markets. Whether you are a seasoned investor or just starting, understanding how to research a stock properly is essential for maximizing your chances of success.
You can gain valuable insights that inform your investment strategy by doing stock research and thoroughly analyzing various factors, such as a company's financials, trajectory and industry trends.
Let's dig into the best practices and effective techniques to research a company before buying stocks, providing you with the tools to analyze stocks confidently.
Understanding the Basics of Stock Research
Stock research is crucial in making informed investment decisions in today's dynamic financial markets. Whether you are an experienced investor investing in blue chip stocks or just starting on your investment adventure investing in penny stocks, understanding how to research a company before buying stocks is essential for maximizing your chances of success.
You can gain valuable insights that inform your investment strategy by learning to analyze stocks based on factors such as a company's financials, industry trends and trajectory.
Let's explore how to investigate stocks and the best practices and effective techniques for researching a company before buying stocks, equipping you with the necessary tools to analyze stocks.
Fundamental Analysis
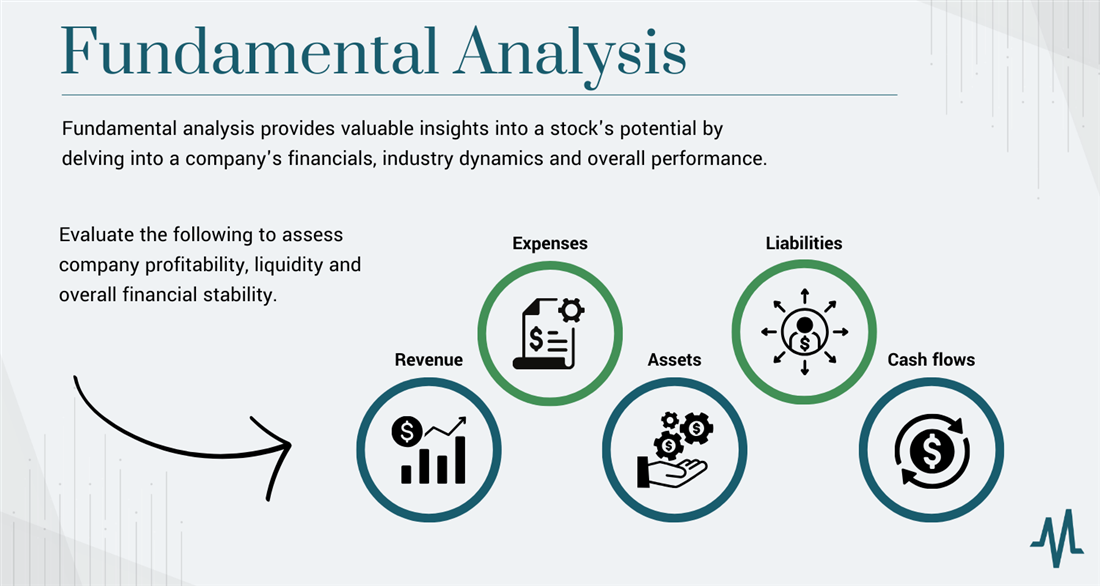
When learning the best way to research stocks, understanding how to conduct fundamental analysis effectively is critical. This process enables investors to thoroughly research a company before buying its stocks, ensuring informed investment decisions. Fundamental analysis provides valuable insights into a stock's potential by delving into a company's financials, industry dynamics and overall performance.
When learning how to research a stock, an excellent starting point is to begin with an in-depth analysis of the company's financial statements. These statements, including the income, balance, and cash flow statements, offer a comprehensive view of the company's financial health.
You can assess company profitability, liquidity and overall financial stability by evaluating:
- Revenue
- Expenses
- Assets
- Liabilities
- Cash flows
Learning how to research a stock before buying includes studying ratio analysis. Ratio analysis is vital in researching stocks by helping you evaluate a company's financial performance and make informed investment decisions.
Key financial ratios provide valuable insights into a company's performance and financial position. Understanding and utilizing key financial ratios will always be crucial when researching a company's stock.
Industry and market analysis are essential when researching a company before buying its stocks. Understanding the industry in which the company operates allows investors to assess its growth potential, competitive dynamics and market trends. You can identify potential risks and opportunities by examining:
- Market size
- Regulatory factors
- Technological advancements
- Position within the industry
Furthermore, investigating a company's management team and corporate governance practices is important. Assessing key executives' competence, experience and track record provides insights into the company's strategic direction and execution capabilities. Evaluating corporate governance ensures transparency, ethical standards and shareholder protection, which are crucial factors in building trust and confidence in the company.
How do you research stocks effectively?
Utilize various resources and tools using online brokerage platforms, financial news websites and specialized research platforms, which offer a wealth of information, including stock quotes, company reports, analyst recommendations and market data.
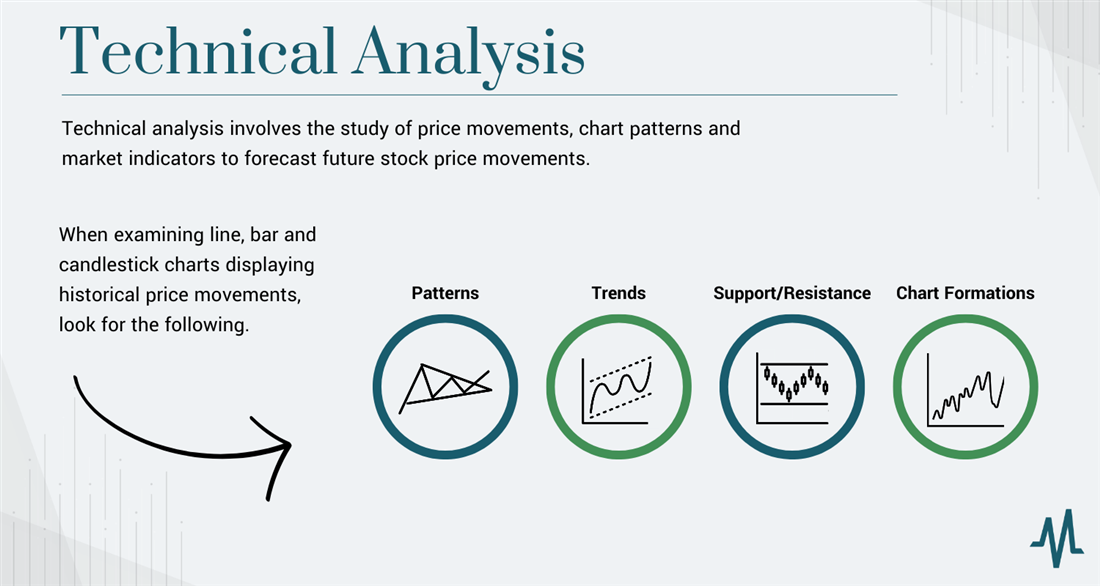
Technical Analysis
In addition to fundamental analysis, technical analysis can help you research and analyze stocks. It involves the study of price movements, chart patterns and market indicators to forecast future stock price movements. You can gain insights into market trends, timing entry and exit points and managing risk.
Technical analysis involves examining charts, such as line, bar and candlestick charts, displaying historical price movements. You can look for:
- Patterns
- Trends
- Support and resistance levels
- Potential chart formations
This information helps understand the overall market sentiment and anticipate future price movements.
 Indicators and Oscillators
Indicators and oscillators applied to price and volume data can generate insights into market trends and momentum. Popular indicators include moving averages, relative strength index (RSI) and stochastic oscillators. These indicators help identify overbought or oversold conditions and trend reversals and provide signals for potential entry or exit points.
Volume Analysis
Volume analysis plays a significant role in technical analysis. It involves studying the trading volume associated with a stock. Analyzing volume patterns and trends provides insights into market participation, confirming price movements and identifying potential reversals. When volume increases during significant price changes, it suggests a higher level of market interest and strengthens the validity of price trends.
Support and Resistance Levels
Support and resistance levels are critical concepts in technical analysis. Support represents price levels where buying pressure exceeds selling pressure, preventing the stock from falling further. Conversely, resistance refers to price levels where selling pressure surpasses buying pressure, limiting upward price movements. Identifying these levels helps investors decide on potential entry or exit points and understand the possible price range a stock might trade within.
Technical Analysis
Technical analysis complements fundamental analysis by providing additional insights into market behavior and short-term price movements. However, it is important to note that technical analysis alone may not provide a complete picture of a company's long-term prospects. Combining fundamental and technical analysis can offer a more holistic approach to researching and analyzing stocks.
By understanding and applying technical analysis techniques, investors can better understand market trends, timing their trades effectively and managing risk. Incorporating technical analysis into the overall stock research process can enhance investment decisions and provide valuable insights into the dynamic nature of the stock market.
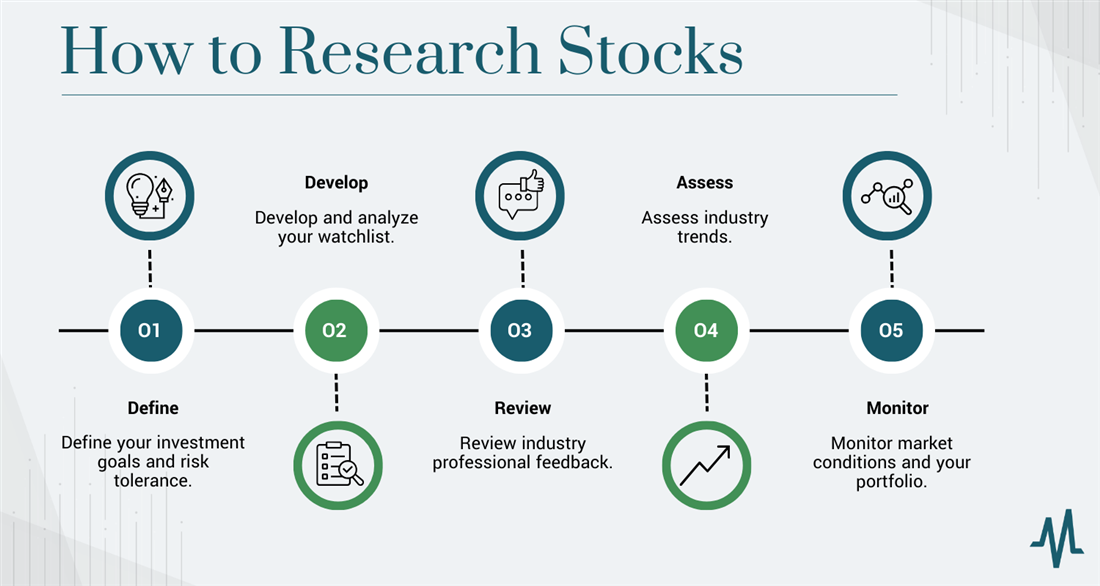
How to Research Stocks
When investing in stocks, conducting thorough research is vital to make informed decisions and maximize your chances of success. Here are some critical steps.
Step 1: Define your investment goals and risk tolerance.
Determine whether your investment objectives focus on long-term growth, income generation or both. Assess your risk tolerance to guide your investment decisions. Determine which sectors or industries align with your investment strategy and interest. Focus your research on companies within those sectors.
Step 2: Develop and analyze your watchlist.
Create a watchlist of potential stocks to watch that meet your investment criteria. You can base this on personal knowledge, recommendations, or screening tools. When researching a company's stock, it is essential to dive into their financial statements, including income statements, balance sheets and cash flow statements. By analyzing these financial statements, you can gain valuable insights into the company's financial performance and stability.
For example, when considering a company like Google NASDAQ: GOOG, examining Google’s financial statements becomes even more critical.
Assessing Google's revenue growth, profitability, debt levels and cash flow trends allows investors to evaluate the company's financial health and sustainability. It provides a deeper understanding of Google's ability to generate revenue, manage expenses and allocate resources effectively, which are crucial factors in assessing its investment potential.
Take advantage of stock screening tools on platforms like MarketBeat that filter stocks based on specific criteria, such as market capitalization, dividend yield or growth rates. Utilize important financial ratios such as price-to-earnings (P/E) ratio, price-to-sales (P/S) ratio, return on equity (ROE) and debt-to-equity ratio.
For example, when examining Tesla NASDAQ: TSLA, keeping a close eye on Tesla’s news headlines, announcements and Tesla’s investor relations page can provide insights into the company's product launches, technological advancements, strategic partnerships and regulatory updates. It also helps identify any management changes, legal issues or market trends that could affect Tesla's business operations and overall investment outlook.
By monitoring news and announcements, you can stay ahead of important updates and make more informed investment decisions. It also helps to review the company’s latest earnings call transcripts to see if it alluded to important things in that meeting. Evaluate the company's strengths, weaknesses, opportunities and threats (SWOT analysis). Identify competitive advantages, potential risks and growth prospects.
Step 3: Review industry professional feedback.
Consider professional analyst and expert research, recommendations and target price estimates like in Microsoft NASDAQ: MSFT. Professional analysts who cover Microsoft provide comprehensive research and evaluations of the company's software and cloud computing businesses, strategic initiatives, and market opportunities.
By reviewing Microsoft’s analyst ratings and reports, you can gain valuable insights into Microsoft's competitive position, revenue growth potential and future prospects. Analysts often offer recommendations based on their analysis, indicating whether the stock is a "buy," "hold" or "sell." These recommendations can serve as a guide for investors when making investment decisions.
Additionally, analysts provide target price estimates, indicating the projected value of the stock over a specific timeframe. This information can assist investors in assessing the potential upside or downside of investing in Microsoft.
Step 4: Assess industry trends.
Next, study the industry dynamics and market trends that influence its operations. When analyzing a stock like Amazon NASDAQ: AMZN, for example, it is crucial to examine factors such as market growth, competition, regulatory environment and technological advancements.
Understanding the e-commerce industry's growth potential, Amazon’s competitive landscape, including players like Walmart and Alibaba and the evolving regulatory policies related to online retail can provide valuable insights into Amazon's market position and future prospects.
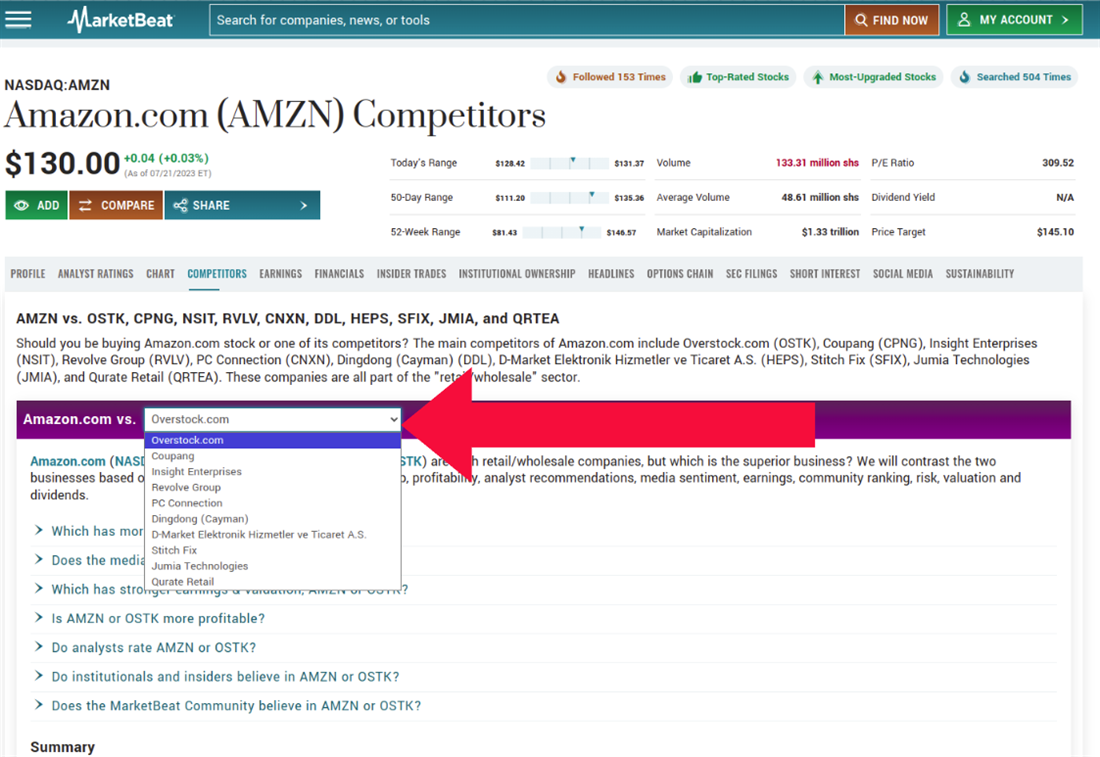
Additionally, assessing technological advancements such as the rise of artificial intelligence, cloud computing and last-mile delivery innovations can help evaluate Amazon's ability to stay ahead in the rapidly evolving market. By analyzing these industry dynamics and market trends, investors can make more informed decisions regarding the company's growth potential and overall investment viability.
Look beyond the numbers and consider qualitative factors like brand reputation, customer satisfaction, corporate culture and innovation potential. Monitor any buying or selling of company shares by insiders, such as executives or board members. One stock that exemplifies the significance of tracking insider transactions is NVIDIA Corporation NASDAQ: NVDA. Keeping an eye on NVIDIA’s insider buying or selling activities can provide valuable clues about the company's future outlook.
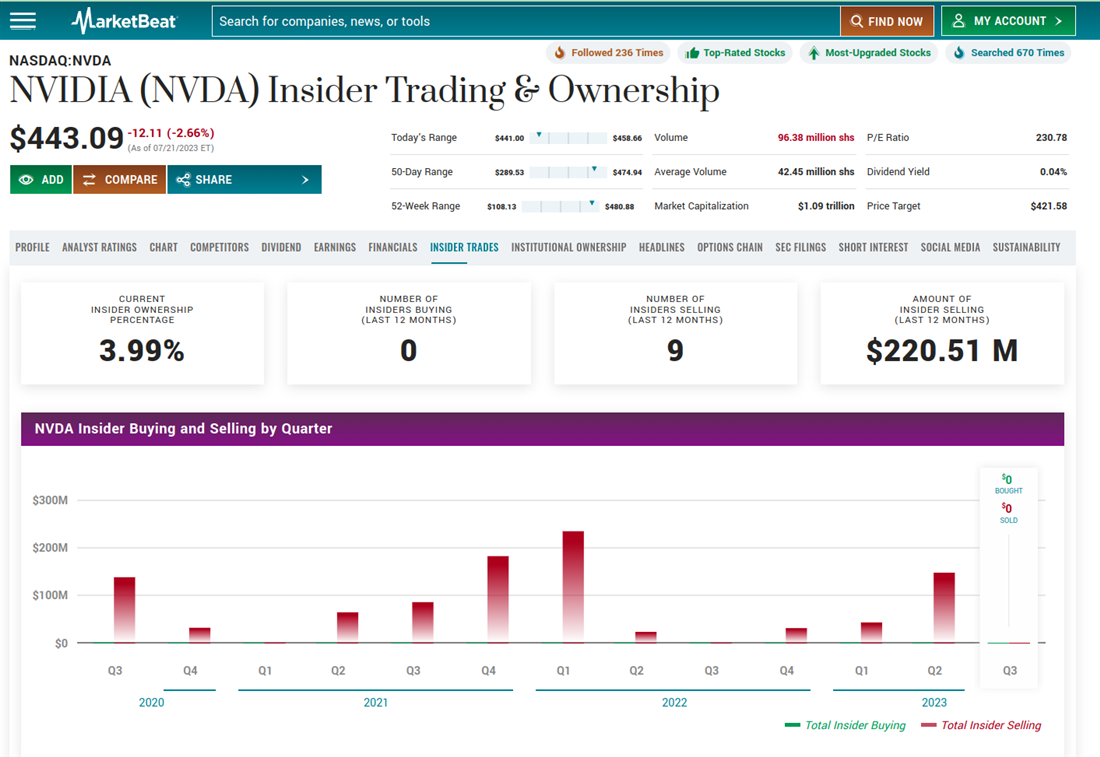
For instance, if several executives or board members consistently buy NVIDIA shares, it may indicate their confidence in the company's growth potential or upcoming positive developments. Conversely, significant insider selling might raise concerns about potential challenges or uncertainties. By monitoring insider transactions, investors can gain additional perspective and use it as a factor in their decision-making process, supplementing other forms of analysis and research.
Step 5: Monitor market conditions and your portfolio.
Stay informed about broader market conditions, economic indicators and geopolitical factors that could impact the stock market and individual stock performance.
Continuously monitor the stocks in your portfolio, review your investment thesis and make adjustments as necessary based on changing market conditions or new information. Keep top-rated stocks in your portfolio, removing any underperforming ones.
Stock research is an ongoing process requiring continuous monitoring and evaluation. The above steps provide a comprehensive framework to guide your research, but it's essential to adapt and refine your approach based on your investment strategy and evolving market conditions.
Important Metrics to Investigate
When conducting in-depth research on stocks, it is crucial to investigate and analyze key metrics that provide valuable insights into a company's financial performance, growth potential and overall investment attractiveness.
These metrics serve as vital indicators that help investors evaluate the strength and stability of a company, assess its ability to generate profits and make informed investment decisions.
Understanding and utilizing these metrics enables you to assess stocks effectively and make informed investment choices in today's dynamic financial markets.
Earnings per Share (EPS)
You can calculate EPS by dividing a company's net profit by its outstanding shares. It indicates the profit generated per share and helps assess a company's profitability and ability to generate earnings for shareholders.
Price-to-Earnings Ratio (P/E)
P/E indicates the market's valuation of a company relative to its earnings. You can calculate the P/E ratio by dividing the current stock price by earnings per share. A higher P/E ratio suggests higher expectations for future growth, while a lower ratio may indicate undervaluation.
Price-to-Sales Ratio (P/S)
The P/S ratio provides insights into the company's valuation relative to its sales. You can calculate it by dividing the stock price by the company's revenue per share. A lower P/S ratio may indicate undervaluation, while a higher ratio may suggest a premium for growth prospects.
Dividend Yield
Dividend yield indicates the return on investment from dividends. You can calculate it by dividing the annual dividend payout per share by the stock price and expressing it as a percentage. A higher dividend yield may be attractive for income-focused investors, while a lower yield may indicate a focus on growth.
Return on Equity (ROE)
ROE shows how effectively the company utilizes shareholder equity to generate profits. A higher ROE indicates efficient utilization of equity. You can calculate ROE by dividing the company's net income by shareholders' equity and expressing it as a percentage.
Debt-to-Equity Ratio
The debt-to-equity ratio assesses the company's leverage and financial risk. You can calculate it by dividing total debt by its shareholders' equity. A higher debt-to-equity ratio may indicate higher financial risk and reliance on borrowed funds.
By examining these metrics and understanding how to calculate them, you can gain valuable insights into a company's financial performance, profitability, efficiency and market valuation. This information is a foundation for making informed investment decisions and assessing the risks and rewards of investing in a particular stock.
Example of Stock Analysis
In this section, we will research an example of stock analysis to demonstrate how to apply the research techniques and metrics discussed earlier in a real-life scenario. By examining the analysis of a specific stock, we can gain practical insights into evaluating its investment potential. We will explore the various factors, metrics and considerations that come into play when analyzing a stock, enabling us to make more informed investment decisions.
For this example, we will analyze Apple Inc.'s NASDAQ: AAPL stock, a comprehensive approach involves examining various factors that provide insights into the company's financial health, market position, growth prospects and overall investment attractiveness.
-
Background: Begin by researching Apple's background, history and position in the technology industry. Understand the company's core products, services and revenue streams, as well as its target market and competitive advantages. Visit Apple’s investor relations page to review any recent communications Apple has directed at its investors. This information helps establish a foundation for further analysis.
-
Financial statements: Evaluate Apple's financial statements, including its income, balance, and cash flow statements. Analyze revenue growth trends, profitability and operating margins over the past few years. Assess key financial ratios such as earnings per share (EPS), return on equity (ROE) and gross margin to gauge the company's financial health and performance.
-
SEC filings: Review any of Apple’s recent SEC filings, such as the annual report (Form 10-K) and quarterly reports (Form 10-Q), provide detailed and reliable information about a company's financial performance, operations and potential risks. These filings offer transparency into a company's financial health, including its profitability, revenue growth, debt levels and liquidity. SEC filings disclose important corporate governance practices, executive compensation and the composition of the board of directors. They also provide insights into risk factors, business operations and the management's discussion and analysis (MD&A) of the company's performance, industry trends and future outlook. SEC filings disclose insider transactions, allowing investors to gauge the actions and confidence of key individuals within the company.
-
Technology industry landscape: Identify trends, opportunities and challenges. Consider technological advancements, market demand for Apple's products and the competitive landscape. Assess Apple's market share, innovation ability and response to changing consumer preferences. Review any news articles about Apple, looking for anything that could influence the stock in either a positive or a negative way.
-
Product portfolio: Focus on key offerings such as the iPhone, iPad, Mac and services like Apple Music, iCloud and the App Store. Evaluate these products' popularity, market acceptance and contribution to Apple's overall revenue and profitability. Consider the potential impact of new product releases or updates.
-
Growth potential: Examine its expansion strategies, investment in research and development and entry into new markets. Evaluate the company's ability to innovate and introduce new products to drive future growth. Consider factors like emerging technologies, market saturation and potential disruptors in the industry.
-
Competitors: Compare Apple to its competitors, such as Samsung, Microsoft and Google. Analyze their market positions, financial performance and product offerings. Evaluate Apple's competitive advantages, brand strength and ability to maintain a competitive edge in the industry.
-
Legal or regulatory issues: Consider any legal or regulatory issues that may impact Apple's operations, such as intellectual property disputes, antitrust concerns, or changes in government regulations. Assess the potential risks and implications for the company's financial performance and stock value.
-
Monitor investor and media sentiment: Review Apple’s analyst recommendations and news updates. Consider factors like Apple’s institutional ownership, looking for major changes in sentiment from institutions. Research Apple’s insider trading activities, looking for company executives buying or selling the stock. Also, consider reviewing Apple’s social media status for company rumors or investment sentiment changes.
-
Short interest: Review Apple’s short interest for insights into market sentiment and potential risks. Short interest refers to the number of shares of a company's stock sold short by investors betting on the stock's decline in value. Assess the potential impact of investor sentiment on the stock's performance.
Identify and evaluate potential risks that could impact Apple's stock value, such as supply chain disruptions, currency fluctuations, geopolitical factors, or changes in consumer preferences. Consider the company's risk management strategies and ability to adapt to unforeseen challenges.
Finally, assess the stock's valuation by analyzing fundamental valuation metrics such as the price-to-earnings ratio (P/E), price-to-sales ratio (P/S) and price-to-book ratio (P/B). Compare these ratios with industry peers to determine if the stock is undervalued or overvalued relative to its earnings and financials.
By thoroughly analyzing these aspects of Apple Inc., investors can understand the company's financial performance, growth potential, competitive landscape and market dynamics. This analysis serves as a foundation for making informed investment decisions and assessing the potential risks and rewards associated with investing in Apple stock.
From Data to Dollars: Harnessing the Potential of Stock Analysis
You gain valuable insights into a company's financials, growth prospects, competitive landscape and industry trends through thorough research and analysis.
By honing these skills and applying best practices, you can confidently navigate the stock market, align your investment strategy with your financial goals and increase your chances of achieving long-term financial success. From data to dollars, stock analysis can help unlock the market's potential and secure your financial future.
Before you consider Alphabet, you'll want to hear this.
MarketBeat keeps track of Wall Street's top-rated and best performing research analysts and the stocks they recommend to their clients on a daily basis. MarketBeat has identified the five stocks that top analysts are quietly whispering to their clients to buy now before the broader market catches on... and Alphabet wasn't on the list.
While Alphabet currently has a "Buy" rating among analysts, top-rated analysts believe these five stocks are better buys.
View The Five Stocks Here
Click the link below and we'll send you MarketBeat's list of the 10 best stocks to own in 2024 and why they should be in your portfolio.
Get This Free Report